How to use Planning Visual
Last updated 1 day ago
Once your tailored Planning Visual is published in BI Book, the real work begins: planning. This article walks you through the essentials, so you can get the most out of your Planning Visual from day one.
You'll learn the basics of navigating the tool, how to use Suggestions to speed up your planning, and how Allocations help you distribute figures accurately across your organization.
Basics
There's more than one way to get data into your Planning Visual: manual input, allocations, subtotals, copying a planning scenario, copying from Excel, copying within Planning, and adjusting several cells at once. This article covers some of these methods, and we'll dive into the rest separately.
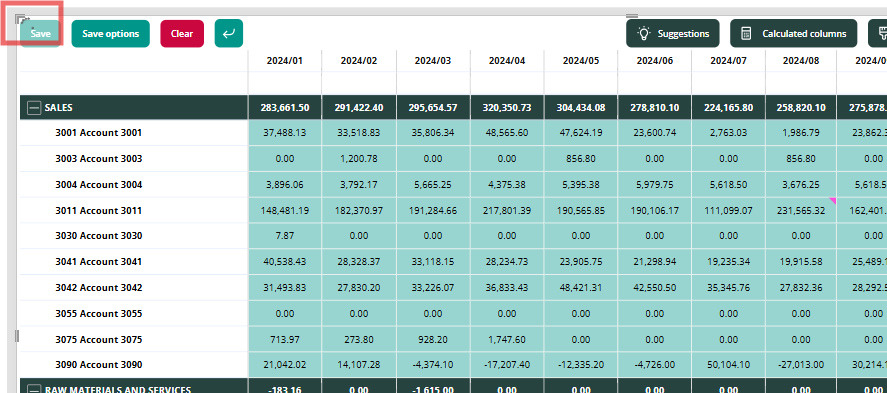
For values to be saved to database, you must remember to press “Save” button.
changes are reflected only after the visual has finished refreshing:
All edited cells are formatted as such. The background color can be adjusted in the visual’s settings
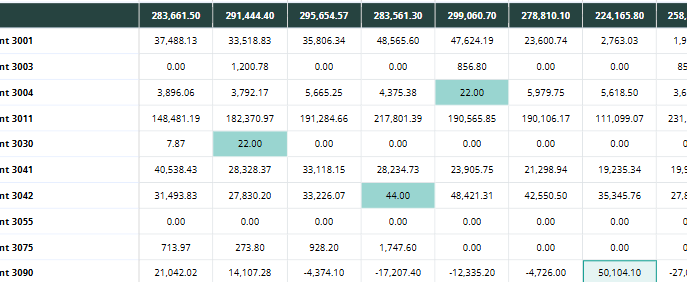
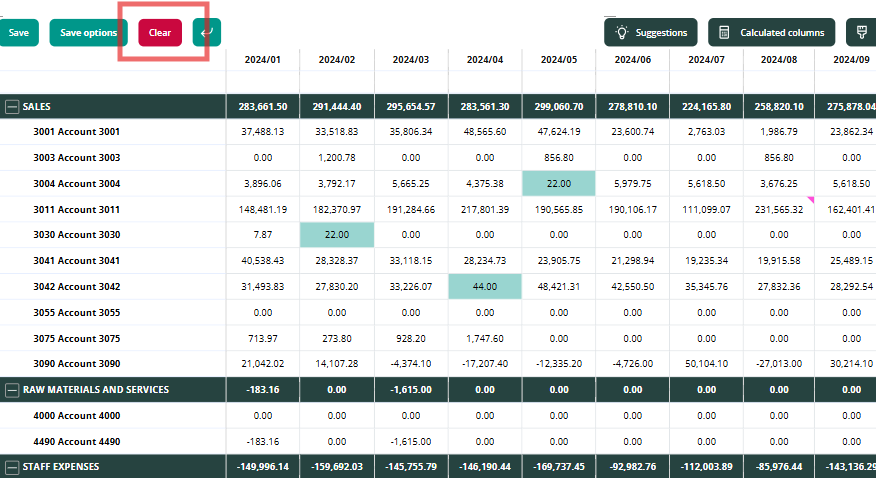
Edited cells are with a light green background You can undo all unsaved changes by pressing “Clear” button
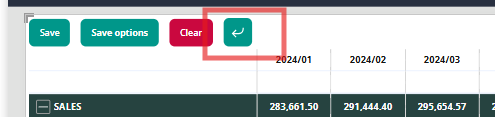
You can undo unsaved changes one by one using Ctrl+Z shortcut or by clicking the undo button:
You can delete values from your Planning visual even if they were saved to the database by just pressing Backspace.
It is possible to lock cells for editing Locked cells feature - BI Book
Manual input
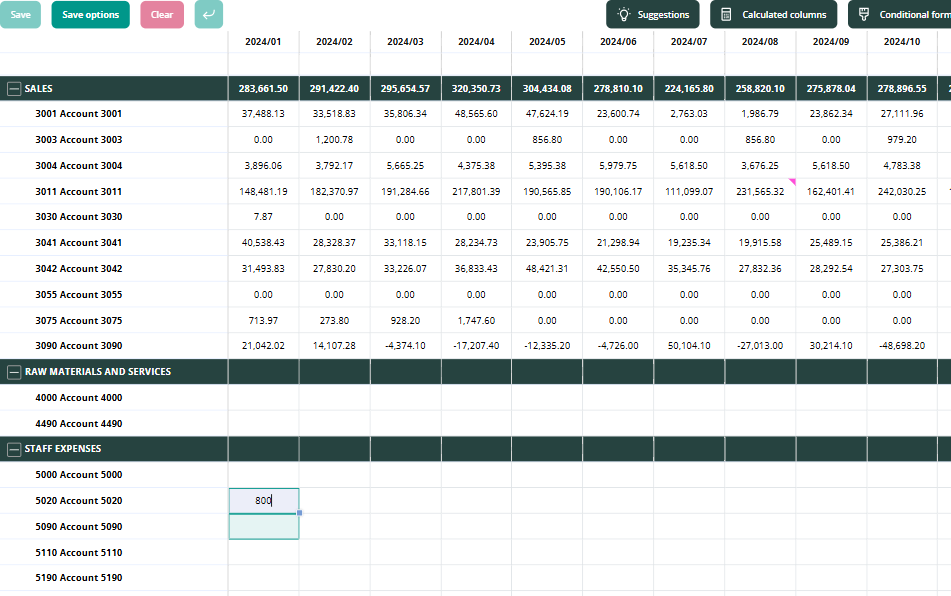
To start planning, simply enter a value into an individual cell. Click the cell directly, or click any editable cell and use your keyboard's arrow keys to navigate to the one you want.
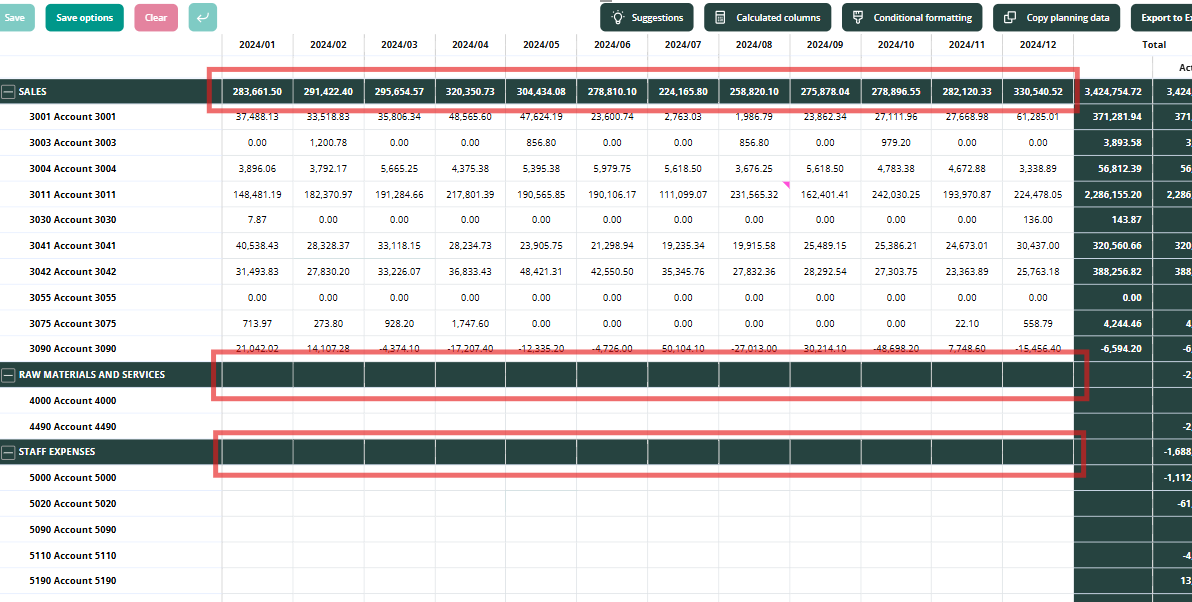
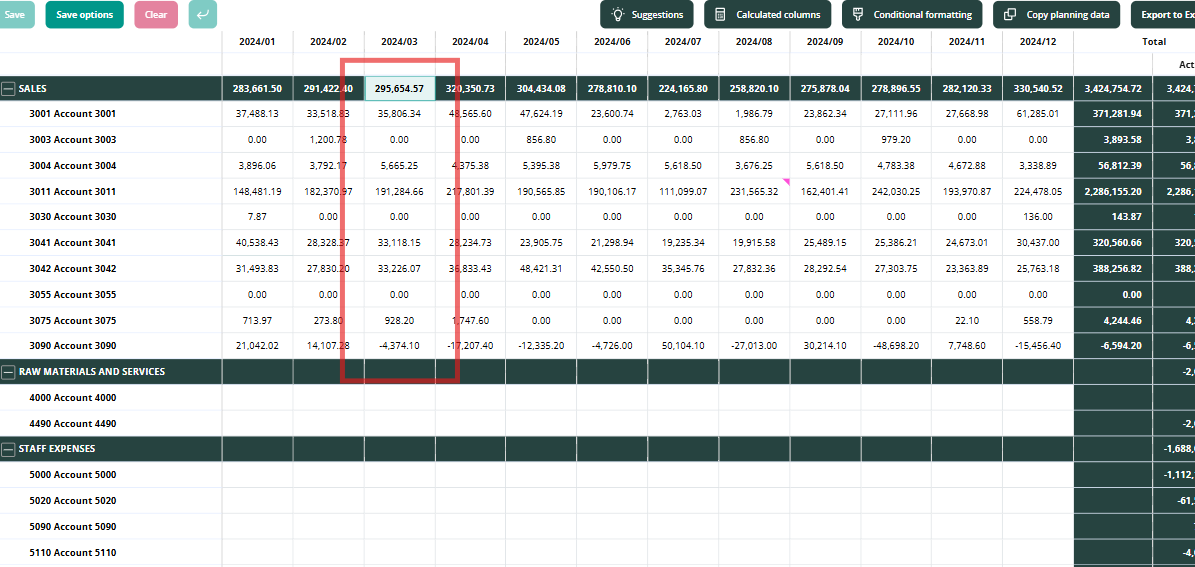
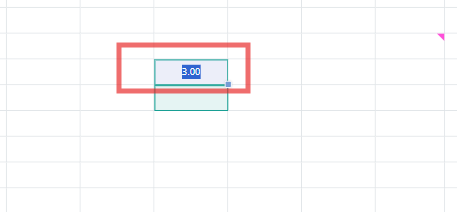
Want to move faster? Edit multiple cells at once by entering a value into a subtotal cell:
Row subtotals distribute the value across that row
Column subtotals distribute the value across that column
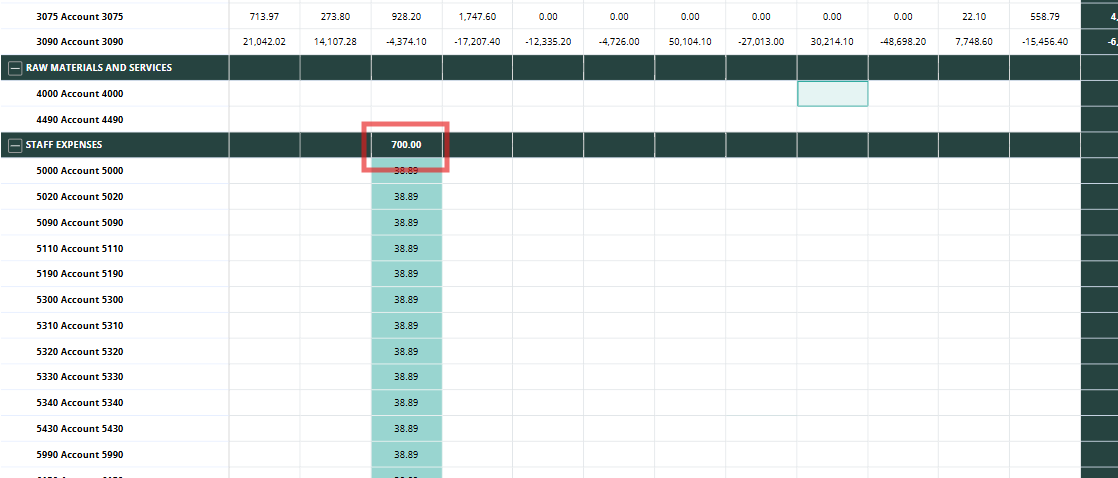
How values are distributed when you edit a subtotal cell
If a column subtotal cell is empty and you enter a value into it, that value is split equally across the cells beneath it.
If a column subtotal cell already has a value and you enter a new one, the new value is split proportionally based on the previous input. Empty cells stay empty.
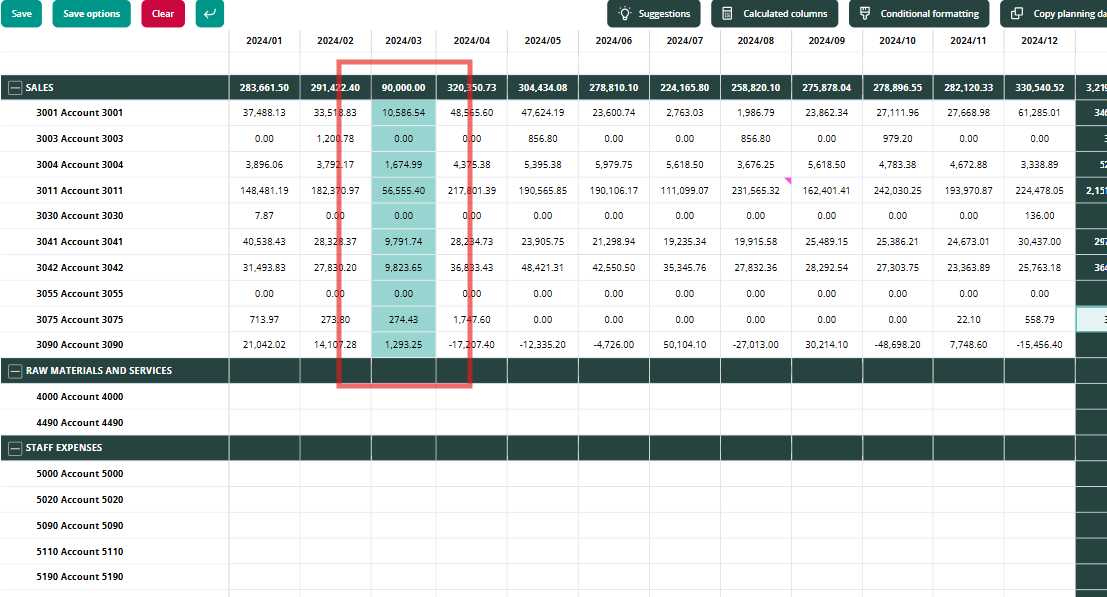
💡Same principles are followed with row subtotals.
Copying planning cells
You can copy/pastes the Planning cell(s) by selecting the cell or range of cells - pressing Ctrl+C - navigating to a cell where you would like to insert the values - pressing Ctrl+V.
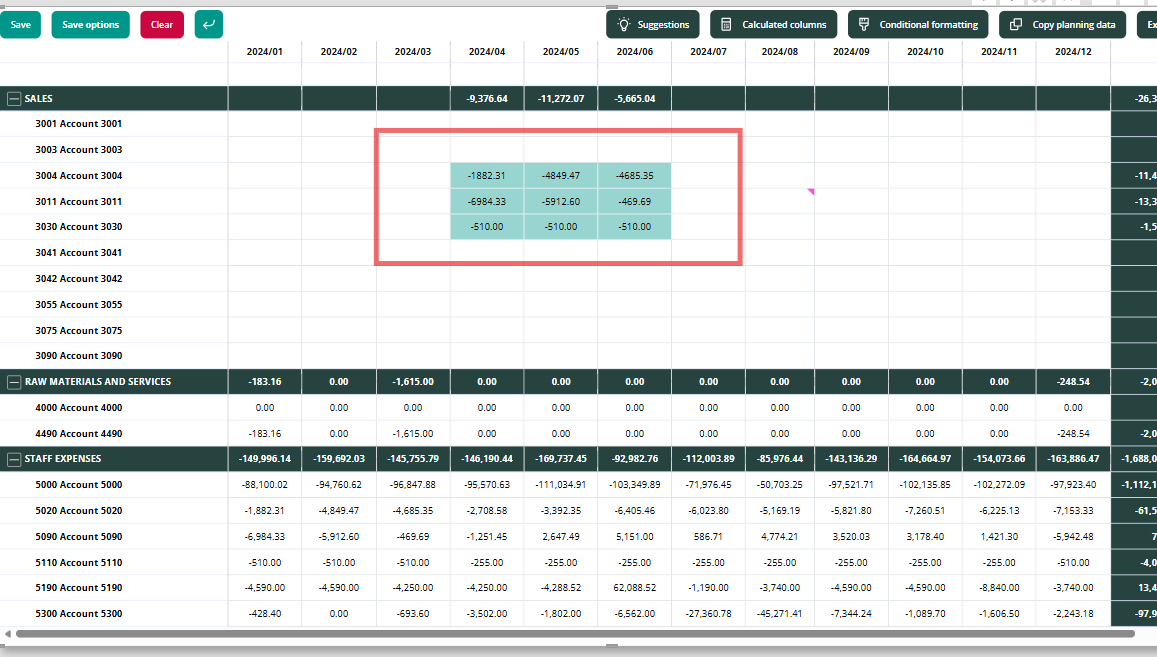
Note: In order for the visual to behave in accordance with the defined logic, please copy/paste the values within the same context.
Practically it means that you can copy and paste the underlying cells freely, but If you attempt to insert copied values into a range of cells that includes a total cell in the middle, it may lead to unexpected results due to the automatic calculations in the total cells.
You can copy a single cell
You can copy a subtotal cell
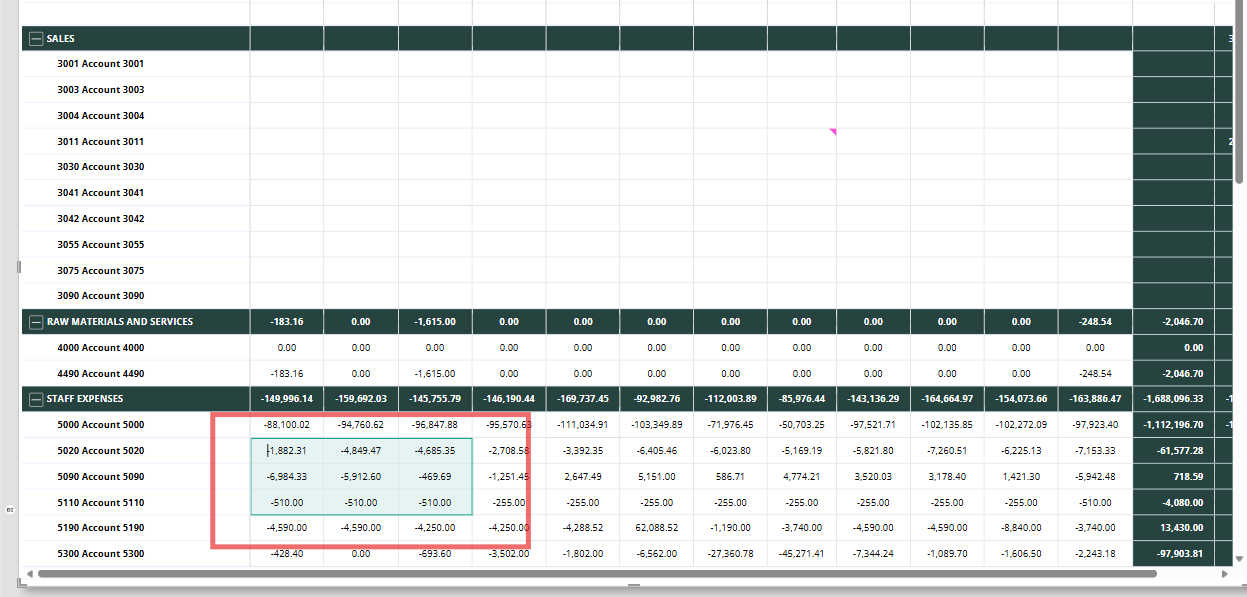
You can copy range of values
Copying values by dragging a cell
You can copy a value by dragging a cell horizontally or vertically. To do this, click the cell to select it first.
Next, click the cell again, hold, and drag it in the direction you want to copy: up, down, right, or left.
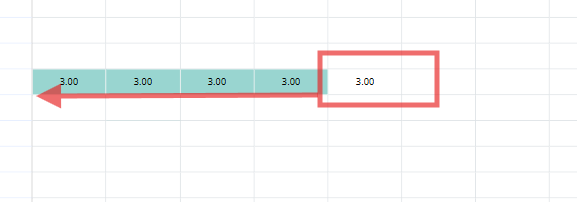
ℹ️ This action is supported also in subtotals
Copying from Excel
You can paste the values from Excel by simply selecting a range of cells in Excel and pasting it to Planning cells. However, similarly to copying withing planning, you should copy/paste the values within the same context to avoid unexpected behaviors.
Suggestions
Suggestions are pre-programmed calculations that can be used to populate your Planning Visual with, for example, last year’s actuals or rolling averages. Your assigned analyst will program suggestion measures based on your preferences and needs. Suggestions are a good jumping off point when the budgeting process starts.
Use case example
Sara estimates that this year’s salaries will be approximately the same as last year’s, so she decides to use Suggestions to populate values faster. She right-clicks the total-column of the salaries row and selects Last Year ACT –suggestion measure. The values in the salaries row are filled in automatically. Sara can now, if needed, adjust the values for this year or save the values as they are.
How to apply suggestions:
There are several ways you can apply suggestions in your planning.
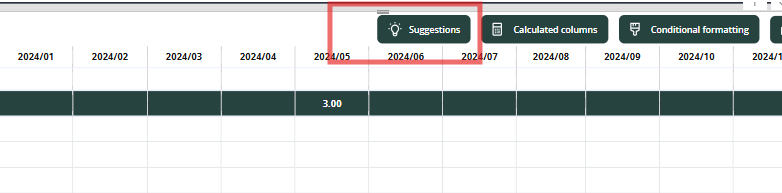
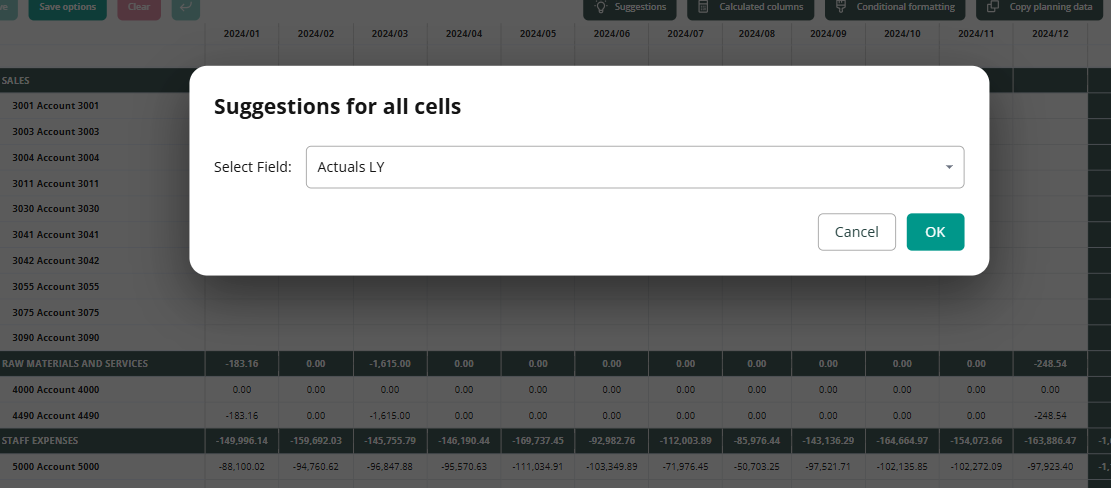
Populating the entire Planning visual with suggestions. In the top-left corner you see Suggestions-button - press on the button - select the suggestion measure from the dropdown - press "OK"
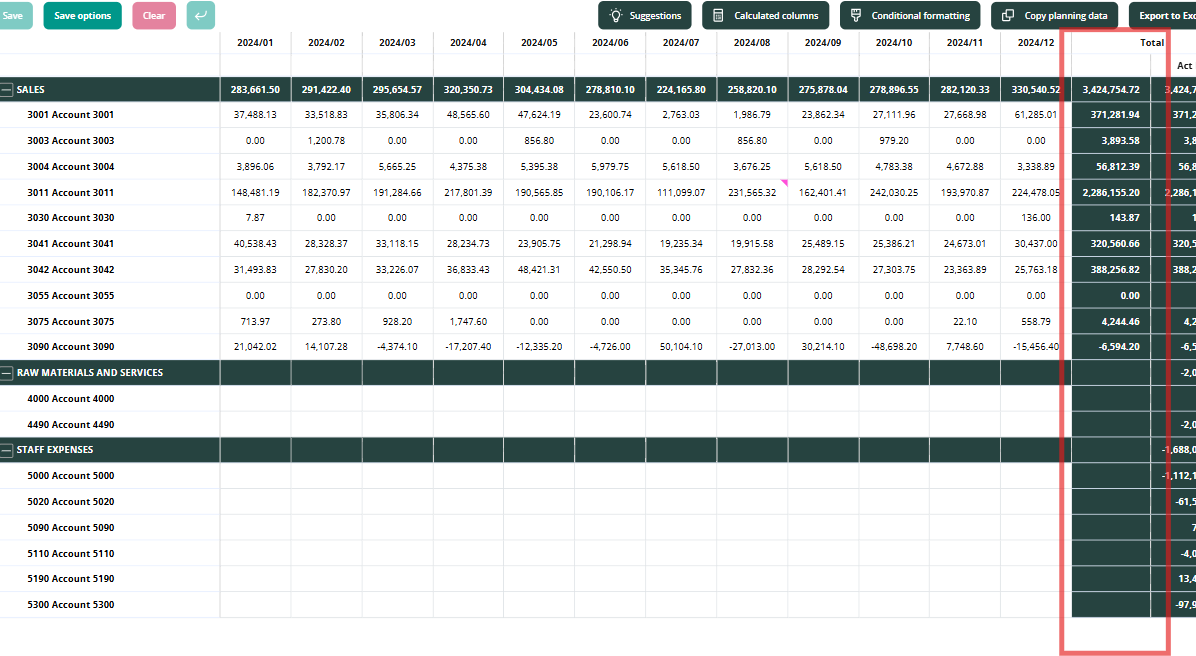
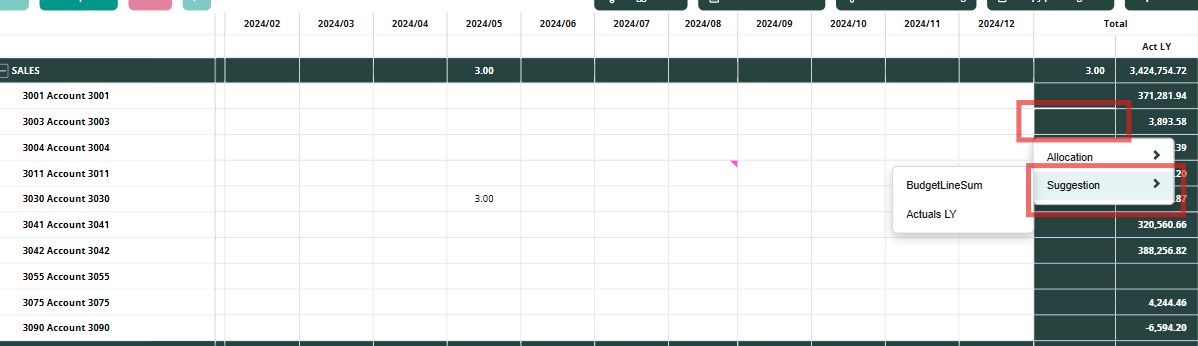
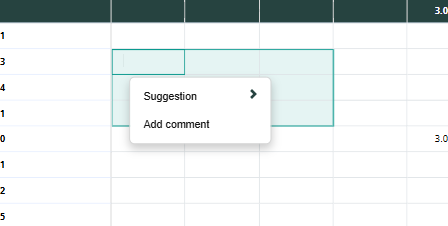
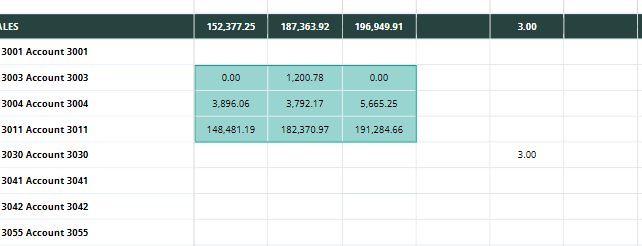
Populating a single column or row with suggestions. Scroll to the Total column or row -right-click the Total cell of the wanted row/column - click Suggestion - select the suggestion measure:
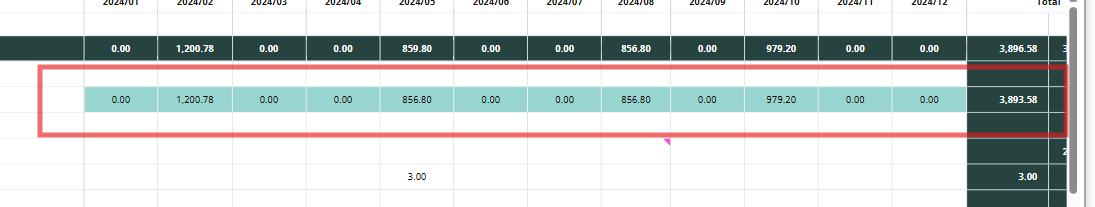
Both the total cell and the underlying cells will be filled in with the suggested values:
Similarly with rows:
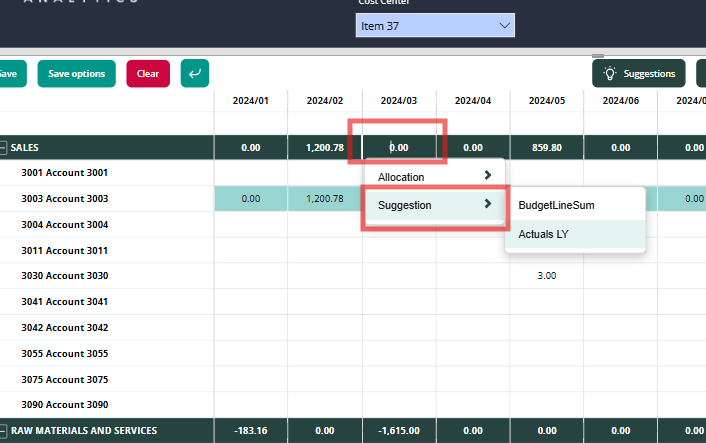
Populating a single cell with suggestion. Right-click the cell - click "Suggestion" - select the suggestion measure.
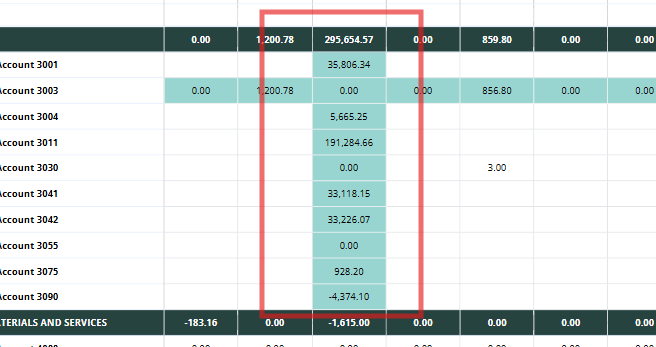
Populating a range of cells with suggestions. Select the range of cells you want to apply the suggestions to - right-click on the range - click "Suggestions" - select the suggestion measure:
Populating multiple totals with suggestions at the same time. Similarly, to the previous case, you case select multiple totals - right-click on the totals range - click "Suggestions" - select the suggestions measure.
Allocations
Allocations are measures that allow you to allocate a manually entered total number to columns or rows based on a pre-programmed calculation. Allocations use the same calculations as suggestion measures but they are only used to allocate total numbers, whereas suggestions will edit the total numbers too.
How to apply allocations
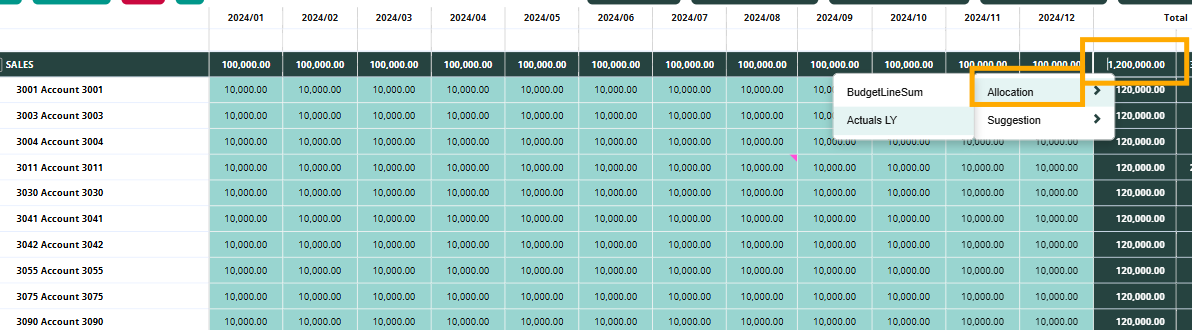
Enter the total number to the total column/row - right-click the cell - click "Allocation" - select the allocation measure:
Use case examples
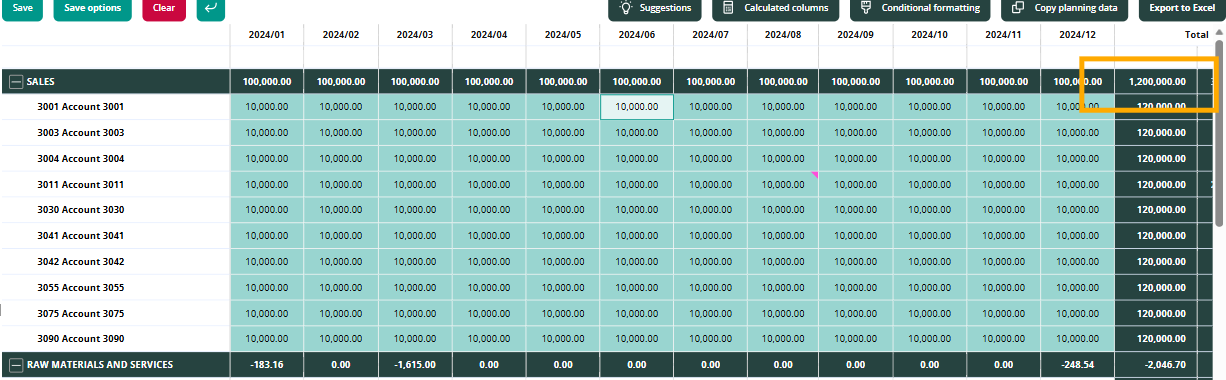
Example 1
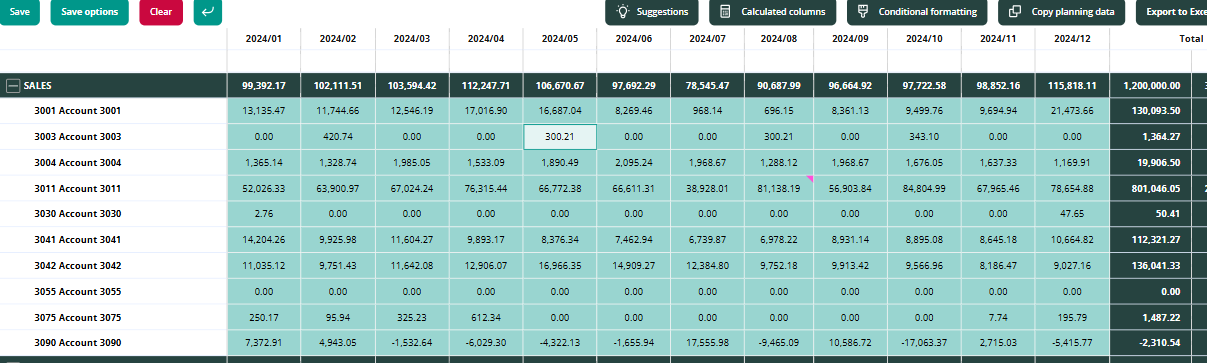
Chris sets the target sales to 1.2M€ and wants to allocate the target to months based on last year’s sales. Chris enters 1.2M€ to the totals > right-click the cell > chooses the allocation measure:
Example 2 (suggestions & allocations):
Markus estimates that marketing costs will be approximately the same as last year but he wants to allocate the total sum evenly to all 12 months. First, Markus fills in the suggestion by right-clicking the total column of marketing costs – row. Then, He right-clicks the cell again and allocates the suggested amount to months by selecting 12M evenly measure.
ℹ️ General note: the measures maybe be named differently in each model as the Planning visual is tailored to each customer's case.